Singapore,you rock all!
Let's all of us celebrate! go www.ndp.org.sg now! yeah!
Monday, July 28, 2008
Monday, July 21, 2008
Monday, July 14, 2008
Friday, July 11, 2008
Monday, July 7, 2008
Saturday, July 5, 2008
Friday, July 4, 2008
Wednesday, July 2, 2008
new age oracle middleware..
Redwood Shores, Calif. 01-JUL-2008 10:15 AM# # # Trademarks
Oracle is a registered trademark of Oracle Corporation and/or its affiliates. Other names may be trademarks of their respective owners.
so get on and get in man! the oracle is strong...
Redwood Shores, Calif. 01-JUL-2008 10:15 AM
- In a live webcast attended by partners and customers from around the world, Oracle President Charles Phillips and Oracle Fusion Middleware Senior Vice President Thomas Kurian outlined Oracle's middleware strategy, which combines the best products from BEA and Oracle Fusion Middleware and provides continuity and investment protection for both customer bases.
- Oracle is #1 in middleware. Oracle's open, standards-based offerings make it the leader in modern middleware.
- Oracle plans to deliver increased functionality and capabilities across its broadened portfolio of products.
- The company unveiled plans for the strategic BEA and Oracle Fusion Middleware products - including plans for Application Server, Tuxedo, BPM, WebCenter, SOA, Development Tools. (For more information and a complete product list please visit: www.oracle.com/goto/july1.)
- Oracle also plans to preserve and expand the partner ecosystem - including System Integrators, Independent Software Vendors, Value-Added Distributors and Value-Added Resellers - to help ease the deployment of Oracle Fusion Middleware.
Supporting Quotes
- "Oracle is number one in middleware," said Oracle President Charles Philips. "The addition of BEA products to the Oracle Fusion Middleware Suite will accelerate innovation in our product offerings, and help our customers strategically implement middleware to more easily build, deploy, and manage applications in a secure environment."
- "As a market leader in SOA implementation, Accenture has had extensive experience and success with both the Oracle and BEA middleware products. By combining leading products and technologies, Oracle has created an Oracle Fusion Middleware road map that is consistent with Accenture's assessment of how a converged product set would best benefit our clients. What's more, the convergence of the two products will increase the momentum of the solutions we develop at the Accenture Innovation Centers for Oracle, and provide a strong SOA platform for our clients," said Paul Daugherty, Accenture's chief technology architect.
- "The integration of the Oracle Fusion Middleware stack and the BEA product family combined with Oracle's standards-based platform offers the potential of a compelling foundation for building solutions to fit the complex and varied collaborations between people, software and machines in today's hospital and healthcare environments," said Rhett Alden, Senior Architect, GE Healthcare IT.
- "Adopting SOA is a way to improve business performance. The combined Oracle & BEA middleware product direction provides greater opportunity to execute an effective SOA strategy and deployment that can help lower costs, increase agility and mitigate risks. HP will continue to leverage our consulting expertise in both Oracle and BEA products to help our joint customers accelerate SOA adoption and drive increased business value," said John McCain, senior vice president and general manager, Consulting and Integration, HP.
About Oracle Fusion Middleware
Oracle Fusion Middleware is a comprehensive, pre-integrated and hot-pluggable product line used by more than 65,000 customers worldwide in every industry. The comprehensive, standards-based family of middleware infrastructure products - ranging from the #1 Java application server to leading Enterprise 2.0 portals and content management products - provides companies and the public sector with the technology solutions they need when they need them. Oracle Fusion Middleware products are pre-integrated with one another and with Oracle Database and Applications products to enable a lower cost of ownership. Unique hot-pluggable capabilities allow customers to extend existing investments in heterogeneous IT environments. Oracle Fusion Middleware is supported by an ecosystem of more than 11,000 independent software vendors, value-added resellers and system integrators. For additional information visit: http://www.oracle.com/middleware.
Supporting Resources
Related Press Releases
Oracle Expert Blogs
Podcasts, Webcasts, Datasheets and Product Brochures
- July 1 Webcast Replay
- Please visit www.oracle.com/goto/july1 for datasheets, product brochures and a complete list of podcasts, including: What's Happening to My Product; WebCenter and Portal Convergence; WebCenter Services - E2.0 for Existing Portals; SOA Suite Combination; SOA Governance Strategy; Tuxedo Strategy; Overall Application Server Strategy
Related Resources
- Information and Updates on the BEA Integration
- What customers are saying
- What partners are saying
- Oracle Mix: BEA Product Information, Downloads, Discussion Forums on July 1
About Oracle
Oracle (NASDAQ: ORCL) is the world's largest enterprise software company. For more information about Oracle, please visit our Web site at http://www.oracle.com.
Oracle is a registered trademark of Oracle Corporation and/or its affiliates. Other names may be trademarks of their respective owners.
so get on and get in man! the oracle is strong...
oracle...taking the advantage of 11g:
REDWOOD SHORES, Calif., 25-JUN-2008 01:47 PM Oracle Corporation (NASDAQ: ORCL) today announced that fiscal 2008 Q4 GAAP earnings per share were up 27% to $0.39, compared to the same quarter last year. Fourth quarter GAAP revenues were up 24% to $7.2 billion, while quarterly GAAP net income was up 27% to $2.0 billion. Total GAAP software revenues were up 26% to $6.0 billion. GAAP new software license revenues were up 27% with database and middleware new license revenues up 23% and applications new license revenues up 36%. GAAP software license updates and product support revenues were up 25% to $2.8 billion. GAAP service revenues were up 18% to $1.3 billion.
# # #
| ORACLE REPORTS Q4 GAAP EPS UP 27% TO 39 CENTS, NON-GAAP EPS UP 27% TO 47 CENTS Q4 Applications New License Revenues Up 36%, Q4 Technology New License Revenues Up 23% |
Fourth quarter non-GAAP earnings per share were up 27% to $0.47, and non-GAAP net income was up 27% to $2.4 billion.
For fiscal year 2008, GAAP earnings per share were up 30% to $1.06. Fiscal year 2008 GAAP revenues were up 25% to $22.4 billion, while annual GAAP net income was up 29% to $5.5 billion. Total GAAP new software license revenues for the year were up 28% to $7.5 billion with database and middleware new license revenues up 24% and applications new license revenues up 38%. For the year, GAAP software license updates and product support revenues were up 24% to $10.3 billion. Annual GAAP service revenues were up 21% to $4.6 billion. GAAP operating margins were up nearly 200 basis points to 35% in FY08.
Fiscal year 2008 non-GAAP earnings per share were up 29% year over year to $1.30. Annual non-GAAP net income was up 28% to $6.8 billion compared to fiscal year 2007.
"Non-GAAP operating margins were up 200 basis points in FY08 to a record 43.0%," said President and CFO Safra Catz. "Non-GAAP earnings per share were up 29% for the year and non-GAAP EPS has tripled over the last five years. Oracle has delivered solid results year-after-year."
"Oracle's application new software license revenues grew 38% in FY08, while SAP's new software license revenues grew only 13% in their most recent fiscal year," said President Charles Phillips. "This is the third consecutive year we've taken applications market share from SAP."
"Four years ago we publicly announced a five year plan to deliver non-GAAP earnings per share at a compound annual growth rate of 20%," said Oracle CEO Larry Ellison. "During the past four years we exceeded our plan and delivered a non-GAAP EPS CAGR of over 26%."
Q4 Earnings AnnouncementOracle will hold a conference call and web broadcast today, June 25th, to discuss these results at 2:00 p.m. (PDT) / 5:00 p.m. (EDT). To access the live web broadcast of this event, please visit the Oracle Investor Relations website at http://www.oracle.com/investor. Please hold down your control key while pressing refresh to ensure that the weblink is visible.
About OracleOracle is the world's largest enterprise software company. For more information about Oracle, including supplemental financial information, please visit http://www.oracle.com/investor or call Investor Relations at (650) 506-4073.
Trademarks
Oracle is a registered trademark of Oracle Corporation and/or its affiliates. Other names may be trademarks of their respective owners.
"Safe Harbor" Statement: Statements in this press release relating to Oracle's future plans and prospects are "forward-looking statements" and are subject to material risks and uncertainties. Many factors could affect our current expectations and our actual results, and could cause actual results to differ materially. We presently consider the following to be among the important factors that could cause actual results to differ materially from expectations: (1) Economic, political and market conditions could adversely affect our revenue growth and profitability through reductions in IT budgets and expenditures. (2) We may fail to achieve our financial forecasts due to such factors as delays or size reductions in transactions, fewer large transactions in a particular quarter, unanticipated fluctuations in currency exchange rates, delays in delivery of new products or releases, or a decline in our renewal rates for software license updates and product support. (3) We cannot assure market acceptance of new products or services or new versions of existing or acquired products or services. (4) We have an active acquisition program and our acquisitions may not be successful, may involve unanticipated costs or other integration issues, or may disrupt our existing operations. (5) Periodic changes to our pricing model and sales organization could temporarily disrupt operations and cause a decline or delay in sales. (6) Intense competitive forces demand rapid technological advances and frequent new product introductions, and could require us to reduce prices or cause us to lose customers. A detailed discussion of these factors and other risks that affect our business is contained in our SEC filings, including our most recent reports on Form 10-K and Form 10-Q, particularly under the heading "Risk Factors." Copies of these filings are available online from the SEC or by contacting Oracle Corporation's Investor Relations Department at (650) 506-4073 or by clicking on SEC Filings on Oracle's Investor Relations website at http://www.oracle.com/investor. All information set forth in this release is current as of June 25, 2008. Oracle undertakes no duty to update any statement in light of new information or future events.
ORACLE CORPORATION
Q4 FISCAL 2008 FINANCIAL RESULTS
CONDENSED CONSOLIDATED STATEMENTS OF OPERATIONS
(in millions, except per share data)
Three Months Ended May 31,
-------------------------------- %Increase
in
% of % of %Increase Constant
2008 Revenues 2007 Revenues in US $ Currency(1)
----------------------------------------------------------
REVENUES
New software
licenses $3,144 44% $2,481 43% 27% 20%
Software
license updates
and product
support 2,830 39% 2,272 39% 25% 18%
---------------------------------
Software
Revenues 5,974 83% 4,753 82% 26% 19%
---------------------------------
Services 1,265 17% 1,075 18% 18% 12%
---------------------------------
Total
Revenues 7,239 100% 5,828 100% 24% 18%
---------------------------------
OPERATING EXPENSES
Sales and
marketing 1,526 21% 1,275 22% 20% 13%
Software
license
updates and
product
support 269 4% 229 4% 17% 11%
Cost of
services 1,072 15% 928 16% 15% 10%
Research and
development 733 10% 600 10% 22% 21%
General and
administrative 201 3% 190 3% 6% 3%
Amortization of
intangible
assets 344 5% 255 5% 35% 35%
Acquisition
related
and other 96 1% 74 1% 30% 30%
Restructuring 27 0% (4) 0% 715% 688%
--------------------------------
Total
Operating
Expenses 4,268 59% 3,547 61% 20% 16%
--------------------------------
OPERATING INCOME 2,971 41% 2,281 39% 30% 20%
Interest
expense (130) (1%) (96) (1%) 35% 35%
Non-operating
income, net 101 1% 79 1% 29% 24%
--------------------------------
INCOME BEFORE
PROVISION FOR
INCOME TAXES 2,942 41% 2,264 39% 30% 20%
--------------------------------
Provision for
income taxes 905 13% 660 11% 37% 34%
--------------------------------
NET INCOME $2,037 28% $1,604 28% 27% 14%
=================================
EARNINGS PER
SHARE:
Basic $0.40 $0.31
Diluted $0.39 $0.31
WEIGHTED AVERAGE
COMMON SHARES
OUTSTANDING:
Basic 5,150 5,122
Diluted 5,233 5,224
(1) We compare the percent change in the results from one period to
another period using constant currency disclosure. We present
constant currency information to provide a framework for assessing
how our underlying businesses performed excluding the effect of
foreign currency rate fluctuations. To present this information,
current and comparative prior period results for entities reporting
in currencies other than United States dollars are converted into
United States dollars at the exchange rate in effect on May 31,
2007, which was the last day of our prior fiscal year, rather than
the actual exchange rates in effect during the respective periods.
The United States dollar weakened relative to major international
currencies in the three months ended May 31, 2008 compared with the
corresponding prior year period, contributing 6 percentage points of
revenue, 4 percentage points of operating expense and 10 percentage
points of operating income growth.
ORACLE CORPORATION
Q4 FISCAL 2008 FINANCIAL RESULTS
RECONCILIATION OF SELECTED GAAP MEASURES TO NON-GAAP MEASURES (1)
(in millions, except per share data)
Three Months Ended May 31, % Increase
in US $
-------------------------------------------------------
2008 2007
2008 Non- 2007 Non- Non-
GAAP Adj. GAAP GAAP Adj. GAAP GAAP GAAP
-------------------------------------------------------
TOTAL REVENUES(2) $7,239 $42 $7,281 $5,828 $55 $5,883 24% 24%
TOTAL SOFTWARE
REVENUES(2) $5,974 $42 $6,016 $4,753 $55 $4,808 26% 25%
New software
licenses 3,144 - 3,144 2,481 - 2,481 27% 27%
Software license
updates and
product
support(2) 2,830 42 2,872 2,272 55 2,327 25% 23%
TOTAL OPERATING
EXPENSES $4,268 $(531) $3,737 $3,547 $(378) $3,169 20% 18%
Stock-based
compensation(3) 64 (64) - 53 (53) - 20% *
Amortization of
intangible
assets(4) 344 (344) - 255 (255) - 35% *
Acquisition
related and
other 96 (96) - 74 (74) - 30% *
Restructuring 27 (27) - (4) 4 - 715% *
OPERATING INCOME $2,971 $573 $3,544 $2,281 $433 $2,714 30% 31%
OPERATING MARGIN % 41% 49% 39% 46% 5% 6%
INCOME TAX EFFECTS
ON ABOVE
ADJUSTMENTS(5) $905 $176 $1,081 $660 $127 $787 37% 38%
NET INCOME $2,037 $397 $2,434 $1,604 $306 $1,910 27% 27%
DILUTED EARNINGS
PER SHARE(6) $0.39 $0.47 $0.31 $0.37 27% 27%
DILUTED WEIGHTED
AVERAGE COMMON
SHARES
OUTSTANDING(6) 5,233 (3) 5,230 5,224 6 5,230 0% 0%
(1) This presentation includes non-GAAP measures. Our non-GAAP measures
are not meant to be considered in isolation or as a substitute for
comparable GAAP measures, and should be read only in conjunction
with our consolidated financial statements prepared in accordance
with GAAP. For a detailed explanation of the adjustments made to
comparable GAAP measures, the reasons why management uses these
measures, the usefulness of these measures and the material
limitations on the usefulness of these measures, please see Appendix
A.
(2) As of May 31, 2008, approximately $205 million in estimated revenues
related to assumed support contracts will not be recognized in
fiscal 2009 due to business combination accounting rules.
(3) Stock-based compensation is included in the following GAAP operating
expense categories:
Three Months Ended Three Months Ended
May 31, 2008 May 31, 2007
------------------ ----------------------------
GAAP Adj. Non-GAAP GAAP Adj. Non-GAAP
------------------------- -------------------------
Sales and marketing $13 $(13) $- $11 $(11) $-
Software license
updates and product
support 2 (2) - 3 (3) -
Cost of services 4 (4) - 4 (4) -
Research and
development 30 (30) - 21 (21) -
General and
administrative 15 (15) - 14 (14) -
------ ------ ------ ------ ------ ------
Subtotal 64 (64) - 53 (53) -
------ ------ ------ ------ ------ ------
Acquisition related
and other 72 (72) - 8 (8) -
------ ------ ------ ------ ------ ------
Total stock-based
compensation $136 $(136) $- $61 $(61) $-
====== ====== ====== ====== ====== ======
(4) Estimated future annual amortization expense related to intangible
assets as of May 31, 2008 is as follows:
Fiscal 2009 $1,660
Fiscal 2010 1,550
Fiscal 2011 1,266
Fiscal 2012 1,126
Fiscal 2013 962
Thereafter 1,831
-------
Total $8,395
=======
(5) The income tax provision was calculated reflecting an effective tax
rate of 30.8% and 29.2% in the fourth quarter of fiscal 2008 and
2007, respectively.
(6) Non-GAAP diluted earnings per share and non-GAAP diluted weighted
average shares outstanding were calculated excluding the effects of
expensing stock options under Statement 123®.
* Not meaningful
ORACLE CORPORATION
FISCAL 2008 YEAR TO DATE FINANCIAL RESULTS
CONDENSED CONSOLIDATED STATEMENTS OF OPERATIONS
(in millions, except per share data)
Year Ended May 31,
----------------------- %Increase
(Decrease)
%Increase in
% of % of (Decrease) Constant
2008 Revenues 2007 Revenues in US $ Currency(1)
---------------------------------------------------------
REVENUES
New software
licenses $7,515 34% $5,882 33% 28% 21%
Software
license updates
and product
support 10,328 46% 8,329 46% 24% 18%
---------------------------------
Software
Revenues 17,843 80% 14,211 79% 26% 19%
---------------------------------
Services 4,587 20% 3,785 21% 21% 15%
---------------------------------
Total
Revenues 22,430 100% 17,996 100% 25% 19%
---------------------------------
OPERATING EXPENSES
Sales and
marketing 4,679 21% 3,907 22% 20% 14%
Software
license
updates and
product
support 997 4% 842 5% 18% 13%
Cost of
services 3,984 18% 3,349 19% 19% 13%
Research and
development 2,741 12% 2,195 12% 25% 22%
General and
administrative 808 4% 692 4% 17% 12%
Amortization of
intangible
assets 1,212 5% 878 5% 38% 38%
Acquisition
related and
other(2) 124 1% 140 1% (11%) (12%)
Restructuring 41 0% 19 0% 113% 95%
---------------------------------
Total
Operating
Expenses 14,586 65% 12,022 67% 21% 17%
---------------------------------
OPERATING INCOME 7,844 35% 5,974 33% 31% 22%
Interest
expense (394) (2%) (343) (2%) 15% 15%
Non-operating
income, net 384 2% 355 2% 8% 5%
---------------------------------
INCOME BEFORE
PROVISION FOR
INCOME TAXES 7,834 35% 5,986 33% 31% 22%
---------------------------------
Provision for
income taxes 2,313 10% 1,712 9% 35% 32%
---------------------------------
NET INCOME $5,521 25% $4,274 24% 29% 18%
=================================
EARNINGS PER
SHARE:
Basic $1.08 $0.83
Diluted $1.06 $0.81
WEIGHTED AVERAGE
COMMON SHARES
OUTSTANDING:
Basic 5,133 5,170
Diluted 5,229 5,269
(1) We compare the percent change in the results from one period to
another period using constant currency disclosure. We present
constant currency information to provide a framework for assessing
how our underlying businesses performed excluding the effect of
foreign currency rate fluctuations. To present this information,
current and comparative prior period results for entities reporting
in currencies other than United States dollars are converted into
United States dollars at the exchange rate in effect on May 31,
2007, which was the last day of our prior fiscal year, rather than
the actual exchange rates in effect during the respective periods.
The United States dollar weakened relative to major international
currencies in the year ended May 31, 2008 compared with the
corresponding prior year period, contributing 6 percentage points of
revenue, 4 percentage points of operating expense and 9 percentage
points of operating income growth.
(2) Acquisition related and other expenses for the year ended May 31,
2008 include a gain on property sale of $57 million. Acquisition
related and other expenses for the year ended May 31, 2007 include a
benefit of $52 million related to the settlement of a pre-
acquisition lawsuit against PeopleSoft, Inc. Please see Appendix A
for further discussion.
ORACLE CORPORATION
FISCAL 2008 YEAR TO DATE FINANCIAL RESULTS
RECONCILIATION OF SELECTED GAAP MEASURES TO NON-GAAP MEASURES (1)
(in millions, except per share data)
% Increase
(Decrease)
Year Ended May 31, in US $
-------------------------------------------------------
2008 2007
2008 Non- 2007 Non- Non-
GAAP Adj. GAAP GAAP Adj. GAAP GAAP GAAP
------------------------ ----------------------------------
TOTAL
REVENUES(2) $22,430 $179 $22,609 $17,996 $212 $18,208 25% 24%
TOTAL SOFTWARE
REVENUES(2) $17,843 $179 $18,022 $14,211 $212 $14,423 26% 25%
New software
licenses 7,515 - 7,515 5,882 - 5,882 28% 28%
Software
license
updates and
product
support(2) 10,328 179 10,507 8,329 212 8,541 24% 23%
TOTAL OPERATING
EXPENSES $14,586 $(1,634) $12,952 $12,022 $(1,235) $10,787 21% 20%
Stock-based
compen-
sation(3) 257 (257) - 198 (198) - 30% *
Amortization of
intangible
assets(4) 1,212 (1,212) - 878 (878) - 38% *
Acquisition
related and
other 124 (124) - 140 (140) - (11%) *
Restructuring 41 (41) - 19 (19) - 113% *
OPERATING
INCOME $7,844 $1,813 $9,657 $5,974 $1,447 $7,421 31% 30%
OPERATING
MARGIN % 35% 43% 33% 41% 5% 5%
INCOME TAX
EFFECTS ON
ABOVE
ADJUSTMENTS(5)$2,313 $535 $2,848 $1,712 $414 $2,126 35% 34%
NET INCOME $5,521 $1,278 $6,799 $4,274 $1,033 $5,307 29% 28%
DILUTED EARNINGS
PER SHARE(6) $1.06 $1.30 $0.81 $1.01 30% 29%
DILUTED WEIGHTED
AVERAGE COMMON
SHARES
OUTSTANDING(6) 5,229 1 5,230 5,269 8 5,277 (1%)(1%)
(1) This presentation includes non-GAAP measures. Our non-GAAP measures
are not meant to be considered in isolation or as a substitute for
comparable GAAP measures, and should be read only in conjunction
with our consolidated financial statements prepared in accordance
with GAAP. For a detailed explanation of the adjustments made to
comparable GAAP measures, the reasons why management uses these
measures, the usefulness of these measures and the material
limitations on the usefulness of these measures, please see Appendix
A.
(2) As of May 31, 2008, approximately $205 million in estimated revenues
related to assumed support contracts will not be recognized in
fiscal 2009 due to business combination accounting rules.
(3) Stock-based compensation is included in the following GAAP operating
expenses:
Year Ended Year Ended
May 31, 2008 May 31, 2007
------------------------- -------------------------
GAAP Adj. Non-GAAP GAAP Adj. Non-GAAP
------------------------- -------------------------
Sales and marketing $51 $(51) $- $38 $(38) $-
Software license
updates and product
support 10 (10) - 11 (11) -
Cost of services 13 (13) - 15 (15) -
Research and
development 114 (114) - 85 (85) -
General and
administrative 69 (69) - 49 (49) -
------ ------ ------ ------ ------ ------
Subtotal 257 (257) - 198 (198) -
------ ------ ------ ------ ------ ------
Acquisition related
and other 112 (112) - 9 (9) -
------ ------ ------ ------ ------ ------
Total stock-based
compensation $369 $(369) $- $207 $(207) $-
====== ====== ====== ====== ====== ======
(4) Estimated future amortization expense related to intangible assets
as of May 31, 2008 is as follows:
Fiscal 2009 $1,660
Fiscal 2010 1,550
Fiscal 2011 1,266
Fiscal 2012 1,126
Fiscal 2013 962
Thereafter 1,831
------
Total $8,395
======
(5) The income tax provision was calculated reflecting a tax rate of
29.5% and 28.6% in the year ended May 31, 2008 and 2007,
respectively.
(6) Non-GAAP diluted earnings per share and non-GAAP diluted weighted
average shares outstanding were calculated excluding the effects of
expensing stock options under Statement 123®. Separately, GAAP
and Non-GAAP diluted earnings per share for the year ended May 31,
2004 were $0.50 and $0.51 per share, respectively.
* Not meaningful
ORACLE CORPORATION
FISCAL 2008 FINANCIAL RESULTS
CONDENSED CONSOLIDATED BALANCE SHEETS
($ in millions)
May 31, May 31,
2008 2007
------------------------
ASSETS
Current Assets:
Cash and cash equivalents $8,262 $6,218
Marketable securities 2,781 802
Trade receivables, net 5,127 4,074
Deferred tax assets 853 968
Other current assets 1,080 821
------------------------
Total Current Assets 18,103 12,883
Non-Current Assets:
Property, net 1,688 1,603
Intangible assets, net 8,395 5,964
Goodwill 17,991 13,479
Other assets 1,091 643
------------------------
Total Non-Current Assets 29,165 21,689
------------------------
TOTAL ASSETS $47,268 $34,572
=========================
LIABILITIES AND STOCKHOLDERS'
EQUITY
Current Liabilities:
Commercial paper and other
current borrowings $1,001 $1,358
Accounts payable 383 315
Income taxes payable 390 1,237
Accrued compensation and
related benefits 1,770 1,349
Accrued restructuring 308 201
Deferred revenues 4,492 3,492
Other current liabilities 1,685 1,435
------------------------
Total Current Liabilities 10,029 9,387
Non-Current Liabilities:
Notes payable, non-current
and other non-current
borrowings 10,235 6,235
Income taxes payable 1,566 -
Deferred tax liabilities 1,218 1,121
Accrued restructuring 260 258
Deferred revenues 262 93
Other long-term liabilities 673 559
------------------------
Total Non-Current
Liabilities 14,214 8,266
Stockholders' Equity 23,025 16,919
------------------------
TOTAL LIABILITIES AND
STOCKHOLDERS' EQUITY $47,268 $34,572
=========================
ORACLE CORPORATION
FISCAL 2008 YEAR TO DATE FINANCIAL RESULTS
CONDENSED CONSOLIDATED STATEMENTS OF CASH FLOWS
($ in millions)
Year Ended May 31,
------------------------
2008 2007
------------------------
Cash Flows From Operating Activities:
Net income $5,521 $4,274
Adjustments to reconcile net income
to net cash provided by operating
activities:
Depreciation 268 249
Amortization of intangible assets 1,212 878
Deferred income taxes (135) (56)
Minority interests in income 60 71
Stock-based compensation 369 207
Tax benefit on the exercise of stock
options 588 338
Excess tax benefits from stock-based
compensation (454) (259)
In-process research and development 24 151
Other gains, net (66) (22)
Changes in operating assets and
liabilities, net of effects from
acquisitions:
Increase in trade receivables, net (661) (479)
Increase in prepaid expenses and
other assets (191) (153)
Decrease in accounts payable and
other liabilities (153) (345)
Increase in income taxes payable 368 279
Increase in deferred revenues 652 387
------------------------
Net cash provided by operating
activities 7,402 5,520
------------------------
Cash Flows From Investing Activities:
Purchases of marketable securities
and other investments (5,624) (5,405)
Proceeds from maturities and sales
of marketable securities and other
investments 4,281 5,756
Acquisitions, net of cash acquired (7,643) (5,005)
Capital expenditures (243) (319)
Proceeds from sale of property 153 2
------------------------
Net cash used for investing
activities (9,076) (4,971)
------------------------
Cash Flows From Financing Activities:
Payments for repurchases of common
stock (2,023) (3,937)
Proceeds from issuance of common
stock 1,288 924
Proceeds from borrowings, net of
financing costs 6,171 4,079
Payments of debt (2,560) (2,418)
Excess tax benefits from stock-based
compensation 454 259
Distributions to minority interests (49) (46)
------------------------
Net cash provided by (used for)
financing activities 3,281 (1,139)
------------------------
Effect of exchange rate changes on
cash and cash equivalents 437 149
------------------------
Net increase (decrease) in cash and
cash equivalents 2,044 (441)
------------------------
Cash and cash equivalents at
beginning of period 6,218 6,659
------------------------
Cash and cash equivalents at end of
period $8,262 $6,218
========================
ORACLE CORPORATION
FISCAL 2008 FINANCIAL RESULTS
FREE CASH FLOW - TRAILING 4-QUARTERS (1)
($ in millions)
Fiscal 2007 Fiscal 2008
-------------------------------------------------------
Q1 Q2 Q3 Q4 Q1 Q2 Q3 Q4
-------------------------------------------------------
GAAP Operating
Cash Flow $4,706 $4,651 $4,984 $5,520 $6,598 $6,957 $7,322 $7,402
Capital
Expenditures(2) (233) (256) (258) (319) (357) (369) (331) (243)
-------------------------------------------------------
Free Cash Flow $4,473 $4,395 $4,726 $5,201 $6,241 $6,588 $6,991 $7,159
=======================================================
% Growth over
prior year 32% 32% 29% 21% 40% 50% 48% 38%
-------------------------------------------------------
GAAP Net Income $3,532 $3,702 $3,970 $4,274 $4,444 4,781 $5,088 $5,521
Free Cash Flow as
a % of Net Income 127% 119% 119% 122% 140% 138% 137% 130%
(1) To supplement our statements of cash flows presented on a GAAP
basis, we use non-GAAP measures of cash flows on a trailing 4-
quarter basis to analyze cash flow generated from operations. We
believe free cash flow is also useful as one of the bases for
comparing our performance with our competitors. The presentation of
non-GAAP free cash flow is not meant to be considered in isolation
or as an alternative to net income as an indicator of our
performance, or as an alternative to cash flows from operating
activities as a measure of liquidity.
(2) Represents capital expenditures as reported in cash flows from
investing activities on our cash flow statements presented in
accordance with GAAP.
ORACLE CORPORATION
FISCAL 2008 FINANCIAL RESULTS
SUPPLEMENTAL ANALYSIS OF GAAP REVENUES AND HEADCOUNT (1)
(in millions, except headcount data)
Fiscal 2007
Q1 Q2 Q3 Q4 TOTAL
REVENUES
New software licenses $804 $1,207 $1,390 $2,481 $5,882
Software license updates
and product support 1,941 2,007 2,108 2,272 8,329
--------------------------------------
Software Revenues 2,745 3,214 3,498 4,753 14,211
Consulting 640 716 694 819 2,869
On Demand 125 140 142 151 557
Education 81 93 80 105 359
--------------------------------------
Services Revenues 846 949 916 1,075 3,785
Total Revenues $3,591 $4,163 $4,414 $5,828 $17,996
=======================================
AS REPORTED REVENUE GROWTH RATES
New software licenses 28% 14% 27% 17% 20%
Software license updates
and product support 29% 29% 24% 21% 25%
Software Revenues 29% 23% 25% 19% 23%
Consulting 33% 42% 38% 30% 35%
On Demand 49% 61% 48% 16% 40%
Education 13% 14% 8% 10% 11%
Services Revenues 33% 41% 36% 26% 33%
Total Revenues 30% 26% 27% 20% 25%
CONSTANT CURRENCY GROWTH RATES
New software licenses 26% 10% 23% 13% 17%
Software license updates
and product support 27% 25% 20% 17% 22%
Software Revenues 27% 19% 21% 15% 20%
Consulting 31% 37% 34% 24% 31%
On Demand 47% 56% 43% 12% 37%
Education 11% 11% 4% 6% 8%
Services Revenues 31% 36% 32% 20% 29%
Total Revenues 28% 23% 23% 16% 22%
--------------------------------------
GEOGRAPHIC REVENUES
REVENUES
Americas $1,956 $2,170 $2,315 $3,018 $9,460
Europe, Middle East &
Africa 1,140 1,422 1,484 1,992 6,037
Asia Pacific 495 571 615 818 2,499
--------------------------------------
Total Revenues $3,591 $4,163 $4,414 $5,828 $17,996
=======================================
HEADCOUNT (2)
GEOGRAPHIC AREA
Americas 26,798 27,444 27,873 29,830
Europe, Middle East &
Africa 14,199 14,640 14,758 15,680
Asia Pacific 24,129 26,350 27,850 29,164
------------------------------
Total Company 65,126 68,434 70,481 74,674
===============================
Fiscal 2008
Q1 Q2 Q3 Q4 TOTAL
REVENUES
New software licenses $1,087 $1,668 $1,616 $3,144 $7,515
Software license updates
and product support 2,383 2,491 2,624 2,830 10,328
--------------------------------------
Software Revenues 3,470 4,159 4,240 5,974 17,843
Consulting 801 877 843 957 3,477
On Demand 158 167 174 194 694
Education 100 110 92 114 416
--------------------------------------
Services Revenues 1,059 1,154 1,109 1,265 4,587
Total Revenues $4,529 $5,313 $5,349 $7,239 $22,430
=======================================
AS REPORTED REVENUE GROWTH RATES
New software licenses 35% 38% 16% 27% 28%
Software license updates
and product support 23% 24% 25% 25% 24%
Software Revenues 26% 29% 21% 26% 26%
Consulting 25% 23% 21% 17% 21%
On Demand 27% 20% 23% 29% 25%
Education 24% 17% 16% 9% 16%
Services Revenues 25% 22% 21% 18% 21%
Total Revenues 26% 28% 21% 24% 25%
CONSTANT CURRENCY GROWTH RATES
New software licenses 32% 31% 9% 20% 21%
Software license updates
and product support 19% 18% 18% 18% 18%
Software Revenues 23% 23% 15% 19% 19%
Consulting 20% 15% 14% 11% 15%
On Demand 23% 15% 17% 23% 19%
Education 20% 10% 9% 2% 10%
Services Revenues 21% 15% 14% 12% 15%
Total Revenues 22% 21% 15% 18% 19%
--------------------------------------
GEOGRAPHIC REVENUES
REVENUES
Americas $2,375 $2,674 $2,707 $3,574 $11,330
Europe, Middle East &
Africa 1,530 1,865 1,871 2,679 7,945
Asia Pacific 624 774 771 986 3,155
--------------------------------------
Total Revenues $4,529 $5,313 $5,349 $7,239 $22,430
=======================================
HEADCOUNT (2)
GEOGRAPHIC AREA
Americas 30,455 30,654 30,624 32,608
Europe, Middle East &
Africa 15,985 16,140 16,383 17,110
Asia Pacific 31,212 32,855 33,212 34,515
----------------------------
Total Company 77,652 79,649 80,219 84,233
==============================
(1) The sum of the quarterly financial information may vary from year-
to-date financial information due to rounding.
(2) Headcount has increased primarily due to our acquisitions.
ORACLE CORPORATION
FISCAL 2008 FINANCIAL RESULTS
SUPPLEMENTAL TOTAL SOFTWARE PRODUCT REVENUE ANALYSIS (1)
($ in millions)
Fiscal 2007
Q1 Q2 Q3 Q4 TOTAL
APPLICATIONS REVENUES
New software licenses $228 $340 $423 $726 $1,716
Software license updates and
product support 703 728 769 832 3,032
------------------------------------
Software Revenues $931 $1,068 $1,192 $1,558 $4,748
======================================
AS REPORTED GROWTH RATES
New software licenses 80% 28% 57% 13% 32%
Software license updates and
product support 51% 45% 27% 23% 35%
Software Revenues 57% 39% 36% 18% 34%
CONSTANT CURRENCY GROWTH RATES
New software licenses 78% 25% 52% 10% 29%
Software license updates and
product support 49% 41% 23% 19% 32%
Software Revenues 55% 35% 32% 15% 31%
------------------------------------
DATABASE & MIDDLEWARE REVENUES
New software licenses $576 $867 $967 $1,755 $4,166
Software license updates and
product support 1,238 1,279 1,339 1,440 5,297
-------------------------------------
Software Revenues $1,814 $2,146 $2,306 $3,195 $9,463
======================================
AS REPORTED GROWTH RATES
New software licenses 15% 9% 17% 18% 16%
Software license updates and
product support 19% 21% 22% 20% 21%
Software Revenues 18% 16% 20% 19% 18%
CONSTANT CURRENCY GROWTH RATES
New software licenses 13% 5% 13% 15% 12%
Software license updates and
product support 18% 18% 19% 17% 18%
Software Revenues 16% 13% 16% 16% 15%
Fiscal 2008
Q1 Q2 Q3 Q4 TOTAL
APPLICATIONS REVENUES
New software licenses $376 $553 $451 $989 $2,369
Software license updates
and product support 886 929 974 1,044 3,833
------------------------------------
Software Revenues $1,262 $1,482 $1,425 $2,033 $6,202
=======================================
AS REPORTED GROWTH RATES
New software licenses 65% 63% 7% 36% 38%
Software license updates
and product support 26% 28% 27% 25% 26%
Software Revenues 36% 39% 20% 30% 31%
CONSTANT CURRENCY GROWTH RATES
New software licenses 61% 56% 2% 31% 33%
Software license updates
and product support 22% 21% 20% 19% 20%
Software Revenues 32% 32% 14% 24% 25%
------------------------------------
DATABASE & MIDDLEWARE REVENUES
New software licenses $711 $1,115 $1,165 $2,155 $5,146
Software license updates
and product support 1,497 1,562 1,650 1,786 6,495
------------------------------------
Software Revenues $2,208 $2,677 $2,815 $3,941 $11,641
=======================================
AS REPORTED GROWTH RATES
New software licenses 23% 29% 20% 23% 24%
Software license updates
and product support 21% 22% 23% 24% 23%
Software Revenues 22% 25% 22% 23% 23%
CONSTANT CURRENCY GROWTH RATES
New software licenses 20% 22% 13% 15% 17%
Software license updates
and product support 17% 16% 17% 17% 17%
Software Revenues 18% 18% 15% 16% 17%
(1) The sum of the quarterly financial information may vary from
year-to-date financial information due to rounding.
ORACLE CORPORATION
FISCAL 2008 FINANCIAL RESULTS
SUPPLEMENTAL GEOGRAPHIC NEW SOFTWARE LICENSE REVENUE ANALYSIS (1) (2)
($ in millions)
Fiscal 2007
Q1 Q2 Q3 Q4 TOTAL
AMERICAS
Database & Middleware $232 $333 $383 $795 $1,743
Applications 126 195 250 415 986
------------------------------------
New Software License
Revenues $358 $528 $633 $1,210 $2,729
====================================
AS REPORTED GROWTH RATES
Database & Middleware 19% 2% 15% 20% 15%
Applications 69% 19% 69% 5% 26%
New Software License
Revenues 33% 8% 31% 14% 19%
CONSTANT CURRENCY GROWTH RATES
Database & Middleware 18% 2% 15% 19% 14%
Applications 69% 19% 69% 4% 26%
New Software License
Revenues 32% 7% 31% 13% 18%
------------------------------------
EUROPE / MIDDLE EAST / AFRICA
Database & Middleware $184 $341 $363 $619 $1,507
Applications 69 101 124 224 518
------------------------------------
New Software License
Revenues $253 $442 $487 $843 $2,025
====================================
AS REPORTED GROWTH RATES
Database & Middleware 12% 21% 15% 20% 18%
Applications 83% 35% 29% 42% 42%
New Software License
Revenues 25% 24% 18% 25% 23%
CONSTANT CURRENCY GROWTH RATES
Database & Middleware 8% 11% 6% 12% 10%
Applications 78% 25% 19% 34% 33%
New Software License
Revenues 21% 14% 9% 18% 15%
------------------------------------
ASIA PACIFIC
Database & Middleware $149 $185 $213 $322 $869
Applications 33 44 49 87 212
------------------------------------
New Software License
Revenues $182 $229 $262 $409 $1,081
====================================
AS REPORTED GROWTH RATES
Database & Middleware 12% 5% 26% 10% 13%
Applications 126% 58% 89% (1%) 36%
New Software License
Revenues 23% 12% 34% 8% 17%
CONSTANT CURRENCY GROWTH RATES
Database & Middleware 13% 2% 24% 7% 11%
Applications 124% 53% 83% (4%) 33%
New Software License
Revenues 24% 9% 32% 5% 15%
------------------------------------
TOTAL COMPANY
Database & Middleware $565 $859 $959 $1,736 $4,119
Applications 228 340 423 726 1,716
------------------------------------
New Software License
Revenues $793 $1,199 $1,382 $2,462 $5,835
====================================
AS REPORTED GROWTH RATES
Database & Middleware 15% 9% 17% 18% 15%
Applications 80% 28% 57% 13% 32%
New Software License
Revenues 28% 14% 27% 17% 20%
CONSTANT CURRENCY GROWTH RATES
Database & Middleware 13% 5% 13% 14% 12%
Applications 78% 25% 52% 10% 29%
New Software License
Revenues 27% 10% 23% 13% 16%
Fiscal 2008
Q1 Q2 Q3 Q4 TOTAL
AMERICAS
Database & Middleware $286 $438 $476 $919 $2,119
Applications 199 306 252 552 1,310
------------------------------------
New Software License
Revenues $485 $744 $728 $1,471 $3,429
====================================
AS REPORTED GROWTH RATES
Database & Middleware 23% 32% 24% 16% 22%
Applications 58% 57% 1% 33% 33%
New Software License
Revenues 35% 41% 15% 22% 26%
CONSTANT CURRENCY GROWTH
RATES
Database & Middleware 22% 29% 21% 13% 19%
Applications 57% 54% (1%) 32% 31%
New Software License
Revenues 34% 38% 12% 20% 23%
------------------------------------
EUROPE / MIDDLE EAST / AFRICA
Database & Middleware $253 $420 $446 $881 $2,000
Applications 123 174 141 317 755
------------------------------------
New Software License
Revenues $376 $594 $587 $1,198 $2,755
====================================
AS REPORTED GROWTH RATES
Database & Middleware 38% 23% 23% 42% 33%
Applications 77% 72% 14% 41% 46%
New Software License
Revenues 49% 34% 21% 42% 36%
CONSTANT CURRENCY GROWTH
RATES
Database & Middleware 30% 12% 11% 27% 20%
Applications 69% 58% 6% 31% 35%
New Software License
Revenues 41% 23% 10% 28% 24%
------------------------------------
ASIA PACIFIC
Database & Middleware $155 $244 $231 $341 $971
Applications 54 73 58 120 304
------------------------------------
New Software License
Revenues $209 $317 $289 $461 $1,275
====================================
AS REPORTED GROWTH RATES
Database & Middleware 4% 32% 8% 6% 12%
Applications 67% 66% 18% 37% 43%
New Software License
Revenues 15% 39% 10% 13% 18%
CONSTANT CURRENCY GROWTH
RATES
Database & Middleware 1% 26% 0% (1%) 5%
Applications 60% 57% 5% 27% 33%
New Software License
Revenues 12% 32% 1% 5% 11%
------------------------------------
TOTAL COMPANY
Database & Middleware $694 $1,102 $1,153 $2,141 $5,090
Applications 376 553 451 989 2,369
------------------------------------
New Software License
Revenues $1,070 $1,655 $1,604 $3,130 $7,459
====================================
AS REPORTED GROWTH RATES
Database & Middleware 23% 28% 20% 23% 24%
Applications 65% 63% 7% 36% 38%
New Software License
Revenues 35% 38% 16% 27% 28%
CONSTANT CURRENCY GROWTH
RATES
Database & Middleware 19% 21% 12% 16% 17%
Applications 61% 56% 2% 31% 33%
New Software License
Revenues 31% 31% 9% 20% 21%
(1) The sum of the quarterly financial information may vary from year-to-
date financial information due to rounding.
(2) New Software License Revenues presented exclude documentation and
miscellaneous revenues.
APPENDIX A
ORACLE CORPORATION
FISCAL 2008 FINANCIAL RESULTS
this is buck earning for oracle man....
EXPLANATION OF NON-GAAP MEASURES
To supplement our financial results presented on a GAAP basis, we use the non-GAAP measures indicated in the tables, which exclude certain business combination accounting entries and expenses related to acquisitions, as well as other significant expenses including stock-based compensation, that we believe are helpful in understanding our past financial performance and our future results. Our non-GAAP financial measures are not meant to be considered in isolation or as a substitute for comparable GAAP measures and should be read only in conjunction with our consolidated financial statements prepared in accordance with GAAP. Our management regularly uses our supplemental non- GAAP financial measures internally to understand, manage and evaluate our business and make operating decisions. These non-GAAP measures are among the primary factors management uses in planning for and forecasting future periods. Compensation of our executives is based in part on the performance of our business based on these non-GAAP measures. Our non-GAAP financial measures reflect adjustments based on the following items, as well as the related income tax effects:
-- Support deferred revenue: Business combination accounting rules require us to account for the fair value of support contracts assumed in connection with our acquisitions. Because these are typically one-year contracts, our GAAP revenues for the one year period subsequent to our acquisition of a business do not reflect the full amount of software license updates and product support revenues on assumed support contracts that would have otherwise been recorded by the acquired entity. The non-GAAP adjustment is intended to reflect the full amount of such revenues. We believe this adjustment is useful to investors as a measure of the ongoing performance of our business because we have historically experienced high renewal rates on support contracts, although we cannot be certain that customers will renew these contracts.
-- Stock-based compensation expenses: We have excluded the effect of stock-based compensation expenses from our non-GAAP operating expenses and net income measures. Although stock-based compensation is a key incentive offered to our employees, and we believe such compensation contributed to the revenues earned during the periods presented and also believe it will contribute to the generation of future period revenues, we continue to evaluate our business performance excluding stock-based compensation expenses. Stock-based compensation expenses will recur in future periods.
-- Amortization of intangible assets expenses: We have excluded the effect of amortization of intangibles expenses from our non-GAAP operating expenses and net income measures. Amortization of intangible assets expenses is inconsistent in amount and frequency and is significantly affected by the timing and size of our acquisitions. Investors should note that the use of intangible assets contributed to revenues earned during the periods presented and will contribute to future period revenues as well. Amortization expenses will recur in future periods.
-- Acquisition related and other expenses, and restructuring expenses: We incurred significant expenses in connection with our acquisitions and also incurred certain other operating expenses or income, which we generally would not have otherwise incurred in the periods presented as a part of our continuing operations. Acquisition related and other expenses primarily consist of in-process research and development expenses, personnel related costs for transitional employees, stock-based compensation expenses (in addition to the stock-based compensation expenses described above), integration related professional services, certain business combination contingency adjustments after the purchase price allocation period has ended, and certain other operating expenses or income, net. Substantially all of the stock-based compensation expenses included in acquisition related and other expenses primarily resulted from unvested options assumed in acquisitions whose vesting was fully accelerated upon termination of the employees pursuant to the original terms of those options. Restructuring expenses consist of Oracle employee severance and other exit costs. We believe it is useful for investors to understand the effect of these items on our total operating expenses. Although acquisition related expenses and restructuring expenses are not recurring with respect to past acquisitions, we will incur these expenses in connection with any future acquisitions.
For the year ended May 31, 2008, acquisition related and other expenses include a gain on property sale of $57 million. For the year ended May 31, 2007, acquisition related and other expenses included a $52 million benefit related to the settlement of a lawsuit filed against PeopleSoft, Inc. on behalf of the U.S. government. This lawsuit was filed in October 2003, prior to our acquisition of PeopleSoft and represented a pre-acquisition contingency that we identified and assumed in connection with our acquisition of PeopleSoft. In October 2006, we agreed to pay the U.S. government $98 million to settle this lawsuit. Since the purchase price allocation period for PeopleSoft ended in the third quarter of fiscal 2006, the favorable difference of $52 million between the estimated exposure recorded for this lawsuit during the purchase price allocation period and the actual settlement amount has been included in our consolidated statement of operations for the year ended May 31, 2007 as a component of acquisition related and other expenses.
the revolution of redhats
Virtualization, the open source way
As IT costs grow and budgets shrink, agile businesses turn to virtualization to make up the difference.
The same development and licensing practices that have improved the enterprise ecosystem and allowed deployments at a fraction of the cost of proprietary engagements are now turning to focus on virtualization technology.
Red Hat's policy of openness, transparency, and collaboration will allow customers even greater freedom of choice in the virtualization space. Projects will no longer be restrained by hardware availability, or even OS support. And, even better, Red Hat offers features that improve the security of virtualized environments and ease the pain of managing and hosting multiple systems or environments. Find out more about today's virtualization opportunities and tomorrow's possibilities.
adapted from http://www.redhat.com/promo/summit/2008/virtualization/?intcmp=70160000000HTJJ
the mac-volution....


 Yes. You can get on the Internet via wireless networks everywhere. Yes. You can connect to networks (both Mac and PC). Yes. You can run Microsoft Office. Yes. You can run Windows. More Frequently Answered Questions


mac is a must have man!
It’s gorgeous. Inside and out.
Since the software on every Mac is created by the same company that makes the Mac itself, you get a completely integrated computer that’s as secure, stable, and powerful as it is elegant and easy to use.
Brains…
What’s inside a Mac? Only the world’s most advanced operating system and a suite of software that’s just as brilliantly designed as the computer itself. Watch the video

…and beauty.
Recyclable glass and aluminum. A trip-proof power cord. A stunning display. Even the keyboard is beautiful. Get a closer look at a few of the design details that make a Mac a Mac. View gallery
It does what a PC does, only better.
A Mac has all the essentials built right in, including the latest wireless technology, advanced Intel chips, and a rock solid operating system that’s loaded with innovations.
Born ready.
Unlike other computers that require you to spend hours configuring devices, a Mac connects to your digital camera, wireless device, or external drive and just works. Really.
Instantly wireless.
A Mac makes wireless easy. Networks automatically appear, and you can get on the Internet with a few clicks.
High performance.
With the latest Intel processors and other engineering leaps, a new Mac does all the things that only a Mac can do — at an astonishing speed.
A conversation piece.
Lots of computers come with built-in cameras these days. But only a Mac comes with iChat software that lets you have four-way video chats,1 give presentations, and even share your screen with people all over the world.
Always up to date.
A Mac regularly checks for updates to Mac OS X and any included Apple software and automatically downloads them. So really, a Mac gets better with age.
Safe for you and your kids.
Designed with security in mind, Mac OS X isn’t plagued by constant attacks from viruses and malware. Likewise, it isn’t inundated by never-ending security dialogs. So you can safely go about your work — or play — without interruption. And easy-to-use parental controls let you manage what your kids can do on the computer and when they can do it.
Made for today
A Mac is built for the way people use computers today, both at home and at work.
- Broadband Internet access required for video chat; fees may apply.
It has the world’s most advanced operating system. And then some.
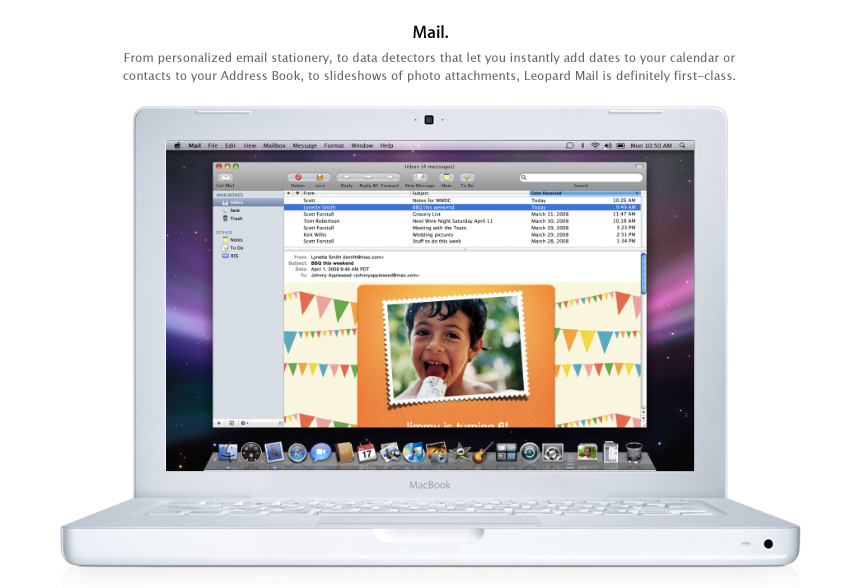
Mac OS X Leopard
No other operating system — Vista included — offers the innovation and simplicity of Mac OS X. With Mac OS X Leopard, the Mac leaps even further ahead with new features that let you do more with less effort. Learn more
Jump-start your digital life.
Get a closer look at just a few of the amazing things you can do within minutes of bringing home a new Mac. View gallery
iLife
“Out of the box,” says Walt Mossberg, of the Wall Street Journal, “the Mac has better photo, music, video, and DVD-creation software than any Windows computer I’ve seen.” That software is called iLife, and it comes standard on every Mac. Learn more

It’s a pleasure to buy and own.
We’ll help you shop.
Visit any Apple Retail Store, and you’ll get expert advice (with no sales pressure) on which Mac is right for you. You can even make an appointment online for a Personal Shopping experience.
Take a tour of the Apple Retail Store. Watch the introduction
Can’t get to a store? The Apple Online Store is the fastest, easiest way to configure and buy a Mac online. If you need help, just call 1-800-MY-APPLE.
We’ll help you move.
Buy a Mac at an Apple Retail Store and a Genius will help you transfer all your files from your old computer to your new one. If you’d rather do it yourself, you can use a USB or FireWire hard drive or a local network to transfer photos, music, documents, and more. Watch the video
We’ll give you support.
Every Mac comes with award-winning support, but you can upgrade to the AppleCare Protection Plan for more peace of mind. And face-to-face help is always available at your local Genius Bar.
We’ll help you learn.
A Mac is made to be easy to use. But if you’re used to working on a Windows PC, you may want some help getting started. Luckily, a Mac comes with lots of options. Get customized One to One training at the Apple Retail Store. View hundreds of tutorials on Apple.com. Get help from others in Apple Support discussions.
mac is a must have man!
Subscribe to:
Posts (Atom)